
Jun 15, 2026
How Pro League Network Replaced a Data Function It Never Had to Build
PLN runs 18+ creator-led sports properties without a data team — by design. Here's how Breadcrumb became their commercial decision layer.
Discover narratives, perspectives, and guidance that will reshape your approach to visualizing data.
Featured
PLN runs 18+ creator-led sports properties without a data team — by design. Here's how Breadcrumb became their commercial decision layer.

Only 7% of posts drove 30% of Nissan's campaign impressions. Here's how PLN's CarJitsu made that proof instant, shareable, and sponsor-ready.
Recent

Sports teams struggle to prove sponsorship ROI because their data lives in silos. Here's what the smartest partnership teams do differently.

The 5 CRO revenue diagnostic questions every Chief Revenue Officer should answer instantly. A sharper alternative to dashboards and quarterly reviews.

A practical VP of ticketing 90 day plan for sports and live entertainment leaders. What to audit, diagnose, and decide before your first quarterly review.

Premium suite sales are up, but renewals are under pressure. Here's how the best sports revenue teams use intelligence to protect high-value accounts.

Sports teams face billions in renewal risk hidden across fragmented systems. AI surfaces behavioral signals 60+ days before churn, turning renewal from a Q4 scramble into year-round intelligence.

Revenue intelligence isn't analytics. It's the difference between knowing what happened and knowing exactly what to do next. Here's why that matters for sports revenue teams.

Manage data sources in a cleaner modal, expand tables to full screen, and define custom semantics right at the source for faster, more accurate insights.
New group improvements help users see the current group, jump with auto pan, reorder groups, and send insights to the right place.

I share how I use KPI reporting to guide decisions, with uses, pros and cons, AI impact, dashboards versus reports, a creation framework, and templates.

How AI helps sports organizations predict behavior, personalize experiences, and drive proactive, real-time fan engagement.

Master data preparation for AI agents and agentic reporting. Learn data standardization, business context definition, and best practices to enable AI-powered reporting agents to deliver trustworthy insights without expensive data warehouses.

How I use pivot tables for exploration and pivot charts for communication—when to choose each and how they work together.
New: AI-powered data tables with full control, customizable KPI charts with change rates (beta), simpler tag-based group rules, and a synthetic data source generator—plus reliability and UX improvements.
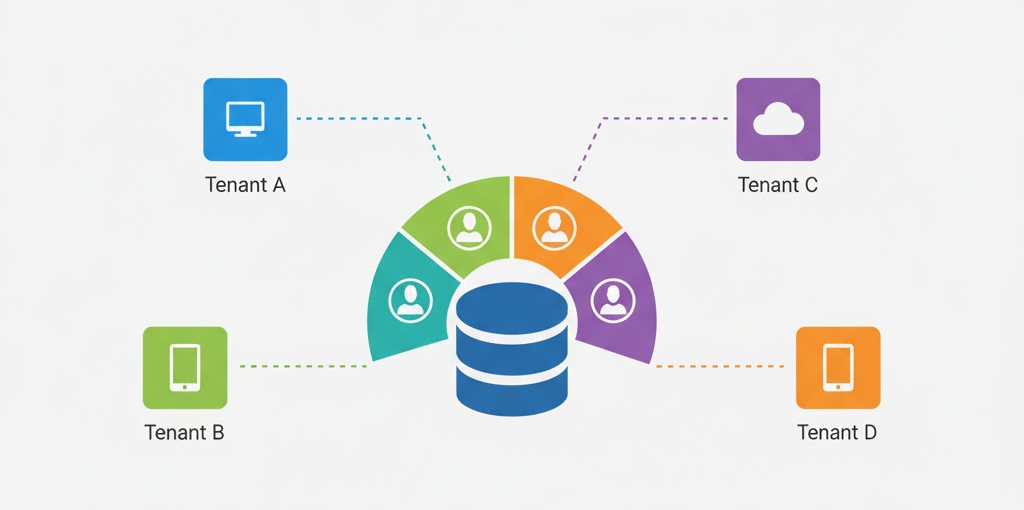
Learn how to design secure and scalable multi-tenant databases for AI-powered analytics and reporting. Explore segmentation strategies, tenant isolation, and row-level security.
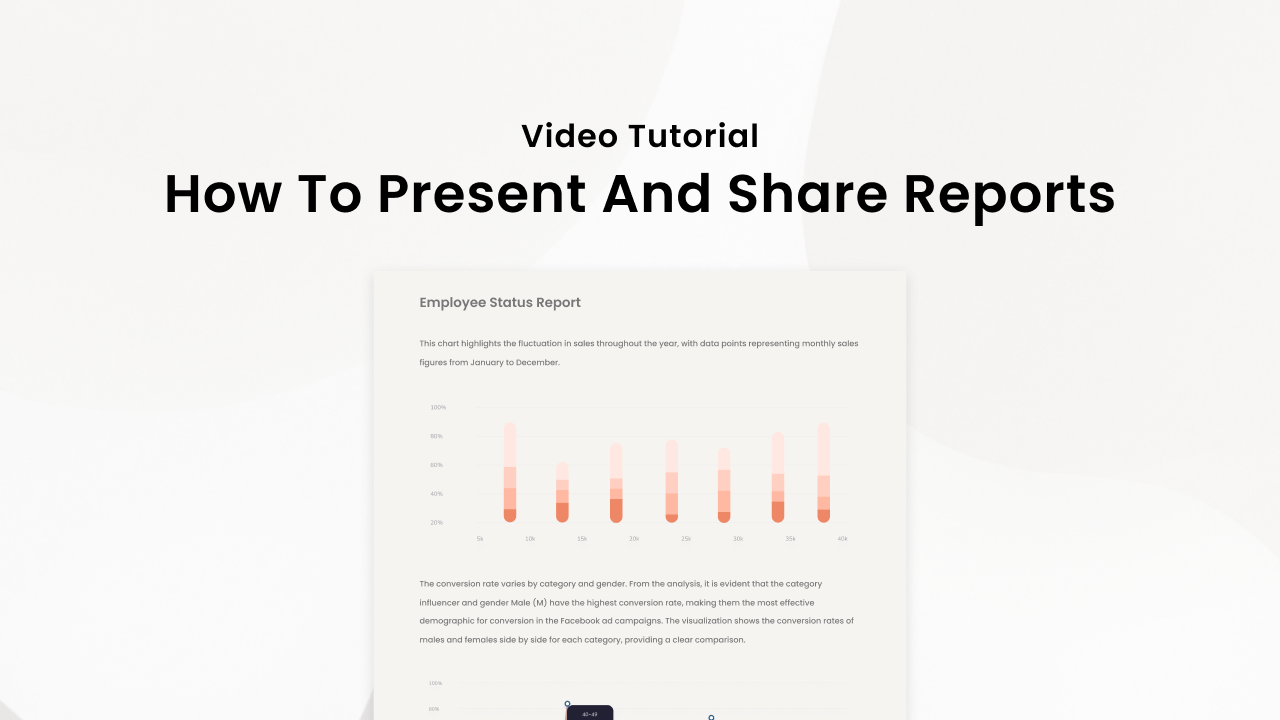
Learn how to transform your data insights into compelling, interactive stories with Breadcrumb's presentation and sharing features. Master the art of report storytelling with our comprehensive tutorial.

Discover how AI-powered data tools can replace Excel for faster, more scalable business insights without formulas or manual data cleaning.
Discover the latest Breadcrumb features including custom instructions, resizable insight groups, batch widget generation, axis editing, and independent panels for a more powerful analytics experience.

Watch our complete feature walkthrough showing how Breadcrumb transforms data analysis from static reports to dynamic, AI-powered insights. See auto-generated dashboards, seamless data combining, and interactive exploration in action.

Discover the best data reporting tools for sharing analytics with clients, stakeholders, and partners. Compare traditional BI platforms with modern AI-powered solutions for external reporting needs.

Learn what raw data table format means, why it's crucial for spreadsheet uploads, and how AI-powered tools like Breadcrumb automatically clean your data for better analytics.

Looking for a Tableau alternative that is faster, easier, and built for non-technical teams? Discover why AI-powered tools like Breadcrumb are replacing static dashboards with dynamic, shareable insights.
Breadcrumb's redesigned dashboard brings chart controls, space management, restore checkpoints, and enhanced AI transparency—all designed to help you get insights faster with better visibility into your data analysis.

Discover how modern AI reporting tools eliminate the need for coding skills or complex training. Learn how anyone can start analyzing data and creating reports in minutes using conversational AI interfaces.

Discover the must-have AI tools that are transforming how data consultants work. From automated analysis to intelligent reporting, learn which tools will give you a competitive edge and help you deliver better client value.

Master the art of prompting for AI data analysis. Learn practical techniques to get better insights faster from tools like Breadcrumb, with real examples and conversation strategies.

Learn how modern sports stadiums are using real-time analytics and AI to transform fan engagement into revenue during live events. Discover 5 key strategies for monetizing behavior as it happens.

Explore the evolving landscape of data analytics in live events, from traditional tools to AI-powered solutions. Discover how modern analytics are transforming event management, attendee engagement, and ROI measurement.
Breadcrumb now supports multiple organizations, shared workspaces, team permissions, and centralized data sources—making it easier than ever to collaborate on data and reports across teams and clients.

Discover 20 essential statistics about live events and stadiums in 2025. Learn why real-time analytics and smart tracking tools are critical and why it's time to adopt agentic reporting.

Is your team drowning in data requests while critical insights sit buried in spreadsheets? Discover the five telltale signs that indicate your organization is ready for agentic reporting—and how it can transform your data operations.

Learn how agentic reporting uses AI-powered agents to automate and scale personalized analytics, eliminating bottlenecks and delivering real-time insights for sports and live events teams.

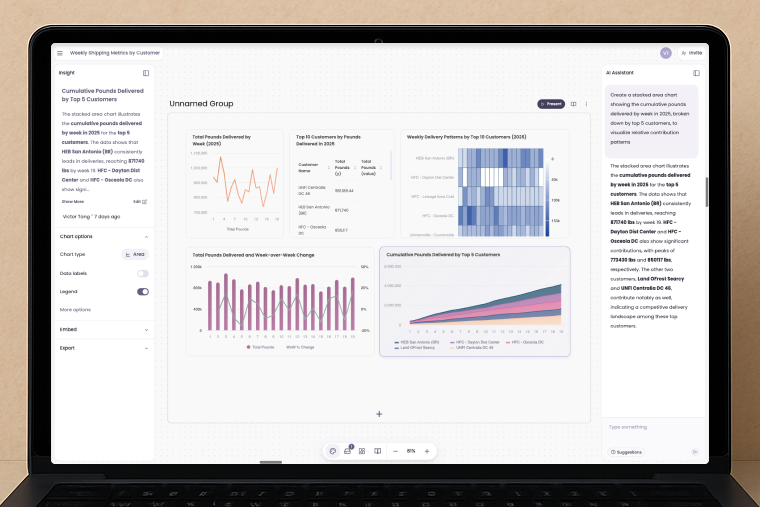
Discover why traditional BI tools like Tableau and Power BI fall short for relationship-driven customer reporting, and how modern AI-powered analytics can transform your customer insights.
Meet our enhanced AI agent that helps you create smarter reports through natural conversations. Get instant guidance, recommendations, and insights with our more intuitive and responsive AI assistant.
Connect directly to more data sources and create better reports with our latest updates. From PostgreSQL to Google Analytics, access all your data in one place with improved KPI widgets and auto-layout features.

Unlock deeper insights from your events by connecting Eventbrite or Ticket Tailor to Breadcrumb. Learn how to combine attendee data with marketing, CRM, and sales sources to understand your audience, optimize ROI, and generate actionable reports — all without a data team.
Discover new features that give you more control over your analytics: group-level AI rules, widget cloning, and SQL transparency. Create consistent, branded reports faster than ever.

Discover the top 3 event reporting metrics partner-facing teams use to engage sponsors and stakeholders. Learn how Breadcrumb delivers instant insights on guest engagement, spend per attendee, and sponsor ROI at live events.

Discover how AI-powered analytics can help you unlock hidden patterns in your Google Analytics data. Get instant insights, automate reporting, and make data-driven decisions faster.

Learn how to transform raw event data into actionable insights using AI tools. Discover strategies for unlocking value from your event analytics to drive better decisions and prove ROI.

Zicket replaced manual spreadsheets with Breadcrumb.ai to deliver faster, AI-powered event reports that clients and sponsors love.
Learn how to create powerful analytics dashboards in Retool without writing any code or SQL. Build and embed dynamic data visualizations in minutes using generative AI.

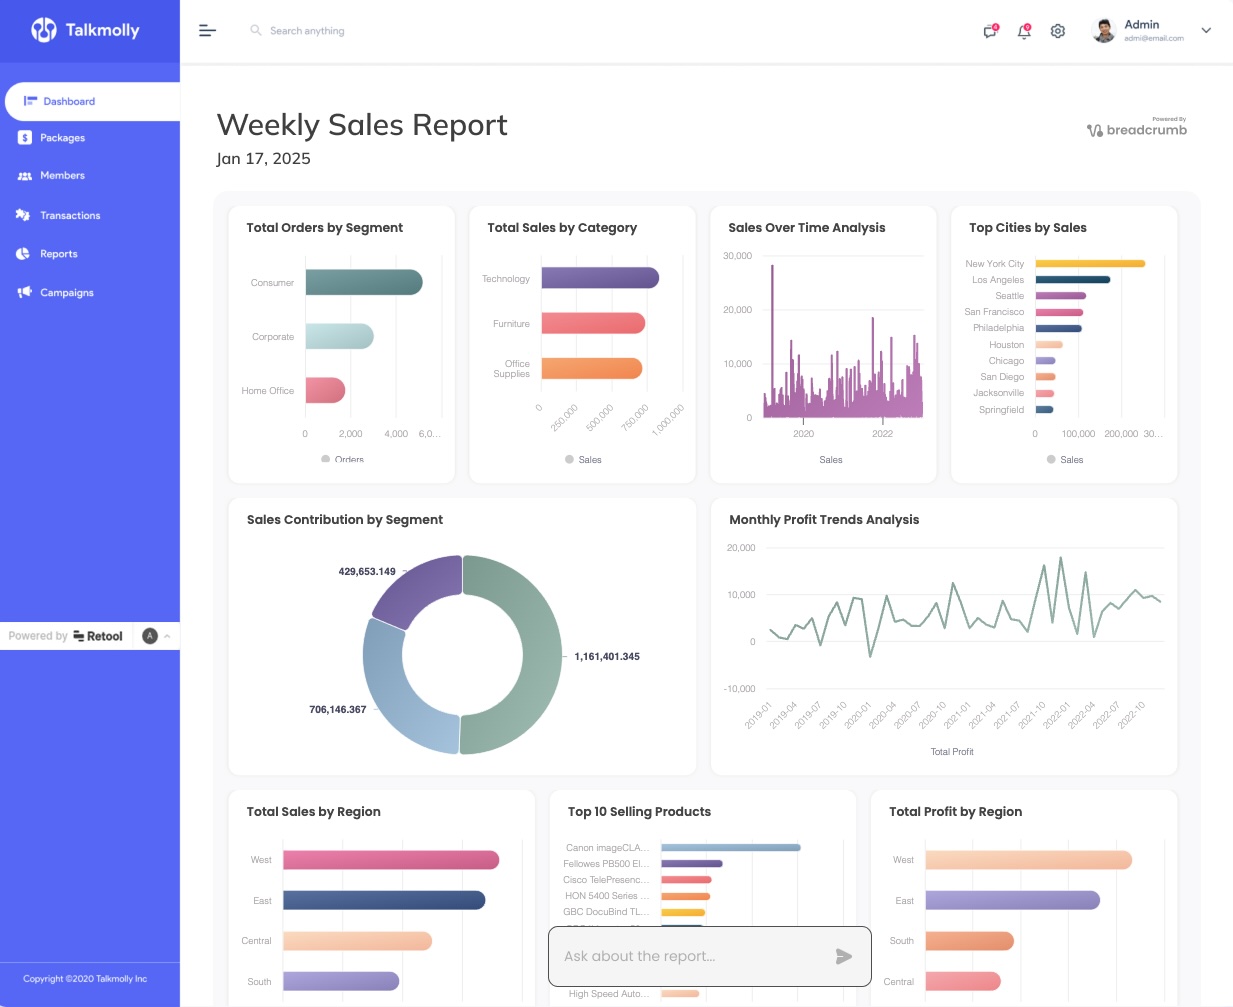
Power BI dashboards often lead to slow updates and limited flexibility. AI-powered reporting allows customers to ask questions, generate custom visuals, and uncover insights instantly — without developer support.

Building truly self-service data products means removing dependencies on data experts by designing intuitive, automated systems.

Transform how consultants and agencies deliver insights with Breadcrumb’s AI-powered report generator, featuring interactive reports, dynamic data visualizations, and automated workflows.

The first wave of the internet disrupted media by shifting competitive advantage from distribution to media. Now, thanks to GenAI, a similar phenomena is happening in the world of analytics.
Breadcrumb Groups, a powerful new feature that allows you to organize multiple dashboards in one workspace for seamless data analysis.

Learn how to set up and use Breadcrumb's AI-powered data analytics dashboard with our quick guide and 'Getting Started' video.

Easily turn complex data into actionable insights with Breadcrumb.ai’s AI-powered visualizations. Discover five ways to create powerful dashboards to tackle key business challenges effortlessly.

Make Google do a double-take with Tailwind CSS's SEO magic. It's like giving your website a makeover that even the search engines can't resist. Astro.js is the wingman for this enchanting journey.

In today’s data-driven landscape, AI-powered dashboards simplify the process of turning large datasets into actionable insights. This post compares five leading AI data dashboards, including our own, Breadcrumb.ai, to help you choose the right tool for your needs.

Streamline your workflow with Breadcrumb’s new sharing and collaboration features. Connect to multiple data sources, including Airtable, for dynamic, instantly shareable visualizations.

Transform your Airtable data into actionable insights with Breadcrumb's powerful visualization and analytics tools. Learn how to create beautiful, interactive dashboards that help you make better business decisions.

Optimize your operations with Breadcrumb. Simplify data integration, ensure data quality, and gain actionable insights effortlessly with our AI-powered dashboard.

Join forces with the dynamic duo of web development – Tailwind CSS and astro.js. They're like Batman and Robin, but for your coding adventures. No capes required

Learn how to overcome Google Forms' limited analytics capabilities and transform your form data into powerful interactive dashboards using AI-powered tools like Breadcrumb.

A year ago it took hours to turn Excel and Google spreadsheets into interactive, shareable dashboards...

For the last decade data tools have been built for data people - making everyone else reliant on them to...