
February 26, 2024 - By: Victor Tang
Use AI to turn ANY spreadsheet into an interactive dashboard in 3 minutes
A year ago it took hours to turn Excel and Google spreadsheets into interactive, shareable dashboards...
The old way of building dashboards
A year ago it took hours to turn Excel and Google spreadsheets into interactive, shareable dashboards. And even then, the technology didn’t exist to interact with your data.
The old workflow required planning a dashboard structure, analyzing data using pivot tables, thinking through how you’re going to visualize data, and hacking in dynamic visualizes using pseudo-code.
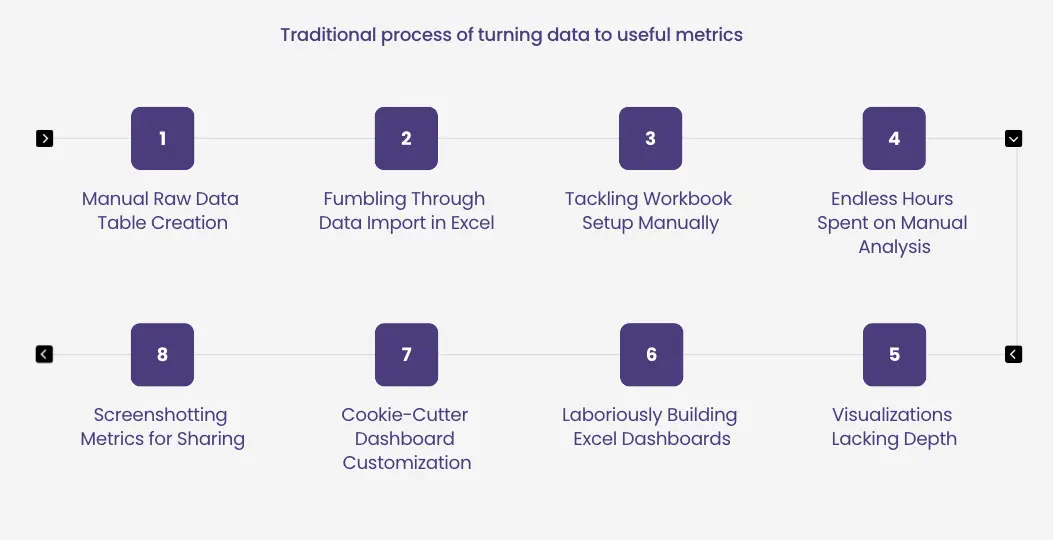
Traditional steps in getting insights from data
- Manual Raw Data Table Creation
- Fumbling Through Data Import in Excel
- Tackling Workbook Setup Manually
- Endless Hours Spent on Manual Analysis
- Visualizations Lacking Depth
- Laboriously Building Excel Dashboards
- Cookie-Cutter Dashboard Customization
- Screenshotting Metrics for Sharing
Unless you’re a master business analyst, building dashboards the old way was guaranteed to take hours if not days of your limited schedule.
A new way with AI
But now, using Breadcrumb, you can use AI to perform the entire data workflow for you.
No more dealing with complex excel formulas, spending hours messing with pivot tables, making sure you’re filtering the right data to get to the result you need.
Breadcrumb completely changes your experience. Do zero planning upfront. Just drop in your data and start exploring the visuals the AI creates for you.
Stuck? Breadcrumb’s AI makes proactive suggestions based on the data you upload.
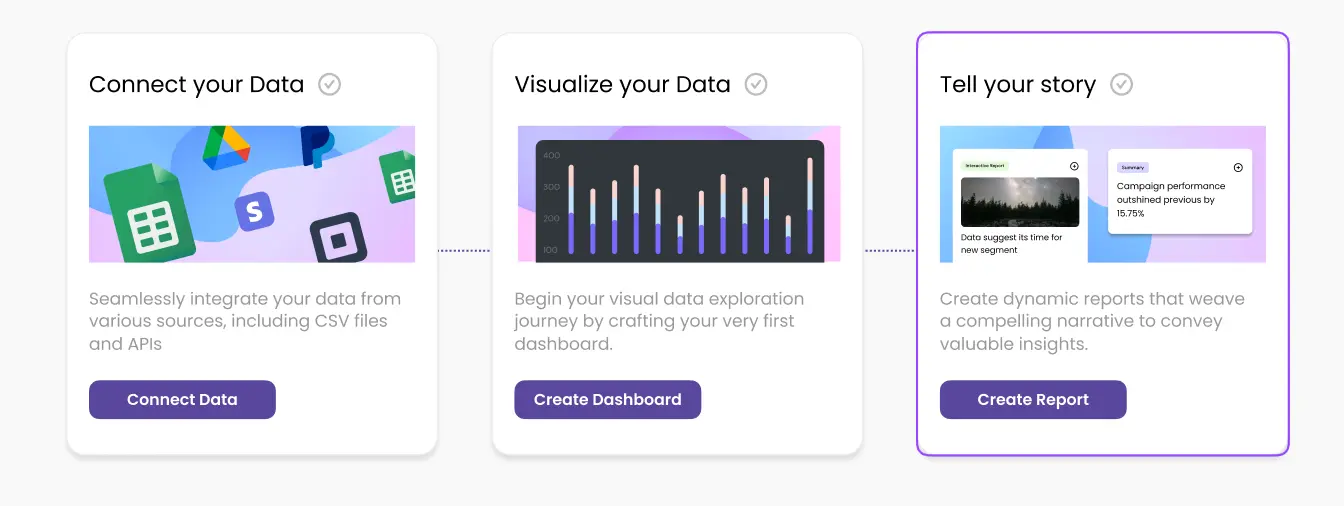
Build a dashboard in 3 minutes with Breadcrumb
To build your first Breadcrumb dashboard, go to breadcrumb.ai and get started free.
- Get started free
- Upload a spreadsheet or use our sample data
- Generate insights
- BOOM → You now have an interactive dashboard from your data.
For questions or inspiration join our Slack community.