
April 24, 2025 - By: Victor Tang
How to Make Your Event Data Actually Valuable with AI Reports
Learn how to transform raw event data into actionable insights using AI tools. Discover strategies for unlocking value from your event analytics to drive better decisions and prove ROI.
The entertainment and live events industry generates an overwhelming amount of data—from ticket scans and RFID pings to concession sales, attendee surveys, and real-time social engagement. But here’s the catch: while this data holds incredible potential, most of it ends up buried in spreadsheets, locked in different tools, or simply ignored.
That’s a missed opportunity.
When used strategically, live events analytics can transform how entertainment companies measure performance, prove ROI to sponsors, and improve experiences for fans. The key is having the right systems in place to unlock that value—and this is where an AI report tool can make all the difference.
In this post, we’ll explore why so much event data goes underutilized, what makes data valuable in the first place, and how event professionals can finally make the most of what they’re already collecting.
Why entertainment data is underused
Most entertainment and live event organizations are already sitting on gold. Whether you’re running a music festival, managing a sports stadium, or organizing branded activations, chances are you’re collecting valuable data every step of the way.
So why doesn’t it get used?
Here are the three biggest reasons:
1. Data is siloed across platforms
Ticketing, POS, RFID, heatmaps, social media mentions—they’re all managed by different vendors or internal teams. When these systems don’t connect, you can’t analyze the full picture. This makes it difficult to answer even basic questions like “Which sponsor booth drove the most engagement?”
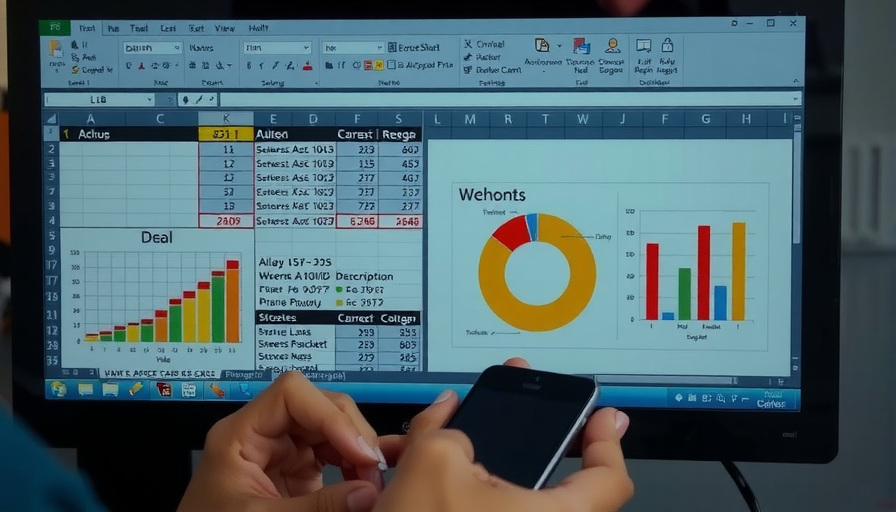
2. Manual reporting is slow and tedious
Building reports the old-fashioned way takes hours, if not days. Pulling CSVs, cleaning data, designing charts—it’s resource-intensive, especially if your team isn’t technical. By the time the report is done, the window to act has passed.
3. Reports aren’t built for stakeholders
Raw data and spreadsheets don’t resonate with sponsors or executives. They want instant insights, not walls of numbers. If your reporting isn’t visual, interactive, and easy to understand, it’s unlikely to influence decisions.
What makes event data valuable?
Before we dive into solutions, let’s define what “valuable” means when it comes to live events analytics.
Data becomes valuable when it helps you:
• Understand behavior: Where do attendees spend their time? What draws their attention?
• Measure performance: How well did a sponsor activation or vendor perform? What were the peak hours?
• Prove impact: Can you show clear ROI to sponsors, partners, and stakeholders?
• Guide decisions: Should you change your venue layout next time? Charge more for premium zones? Adjust your programming?
The catch? This only works if your data is accessible, timely, and understandable—three things that traditional reporting often fails to deliver.
What is an AI report tool—and why does it matter?
An AI report tool or AI report builder is designed to automate the heavy lifting of analyzing and visualizing your event data. Instead of relying on analysts or manual spreadsheets, these tools use artificial intelligence to process data from multiple sources, detect patterns, and generate ready-to-share reports in minutes.
For entertainment and live events teams, that means:
• Real-time analytics without manual effort
• Automated summaries that highlight key trends
• Visual dashboards that are easy to share with sponsors, partners, and internal teams
• Faster turnaround from event wrap-up to stakeholder presentation
In short, an AI-powered approach to live events analytics turns raw data into action—and it does it fast.
How to unlock more value from your existing data
You don’t need to collect more data. You need to use it better. Here’s how to turn your existing data into something that drives results using modern tools.
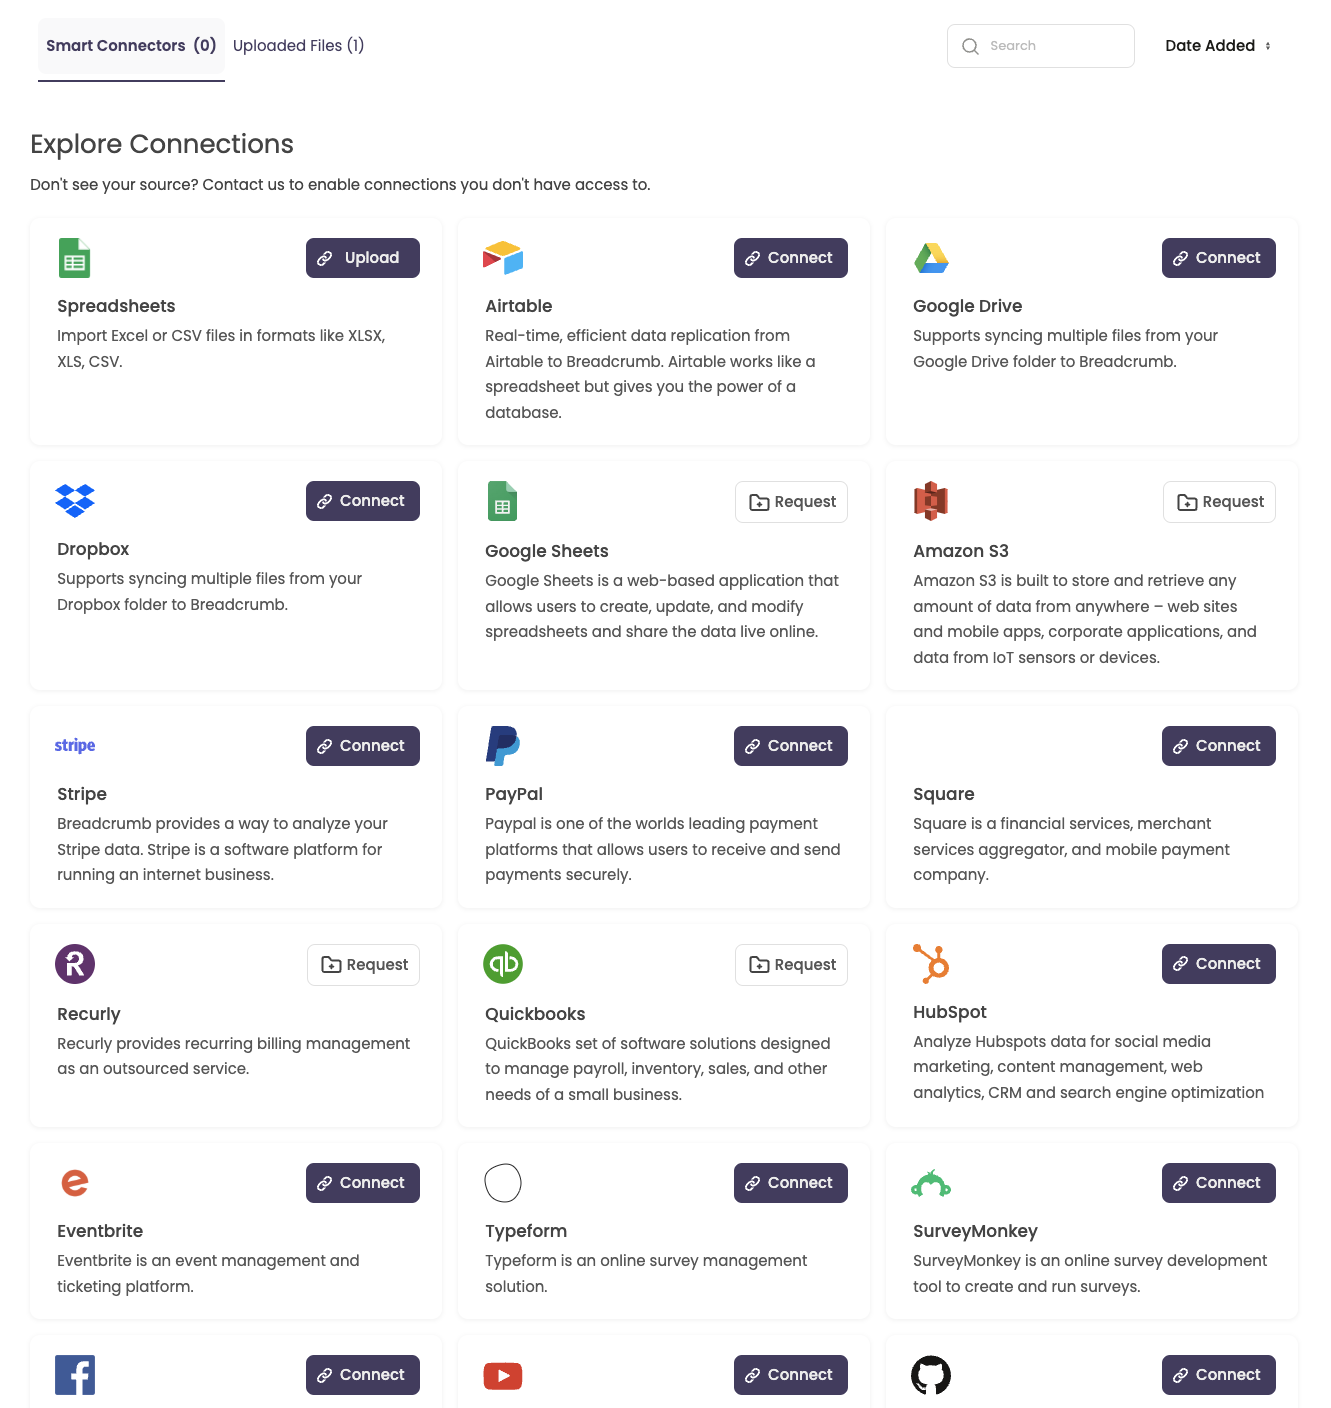
1. Centralize your data sources
Start by connecting your ticketing platform, point-of-sale system, RFID or QR code scans, and social listening tools into one unified view. An AI report tool can then pull from these sources to detect trends, flag anomalies, and surface insights automatically.
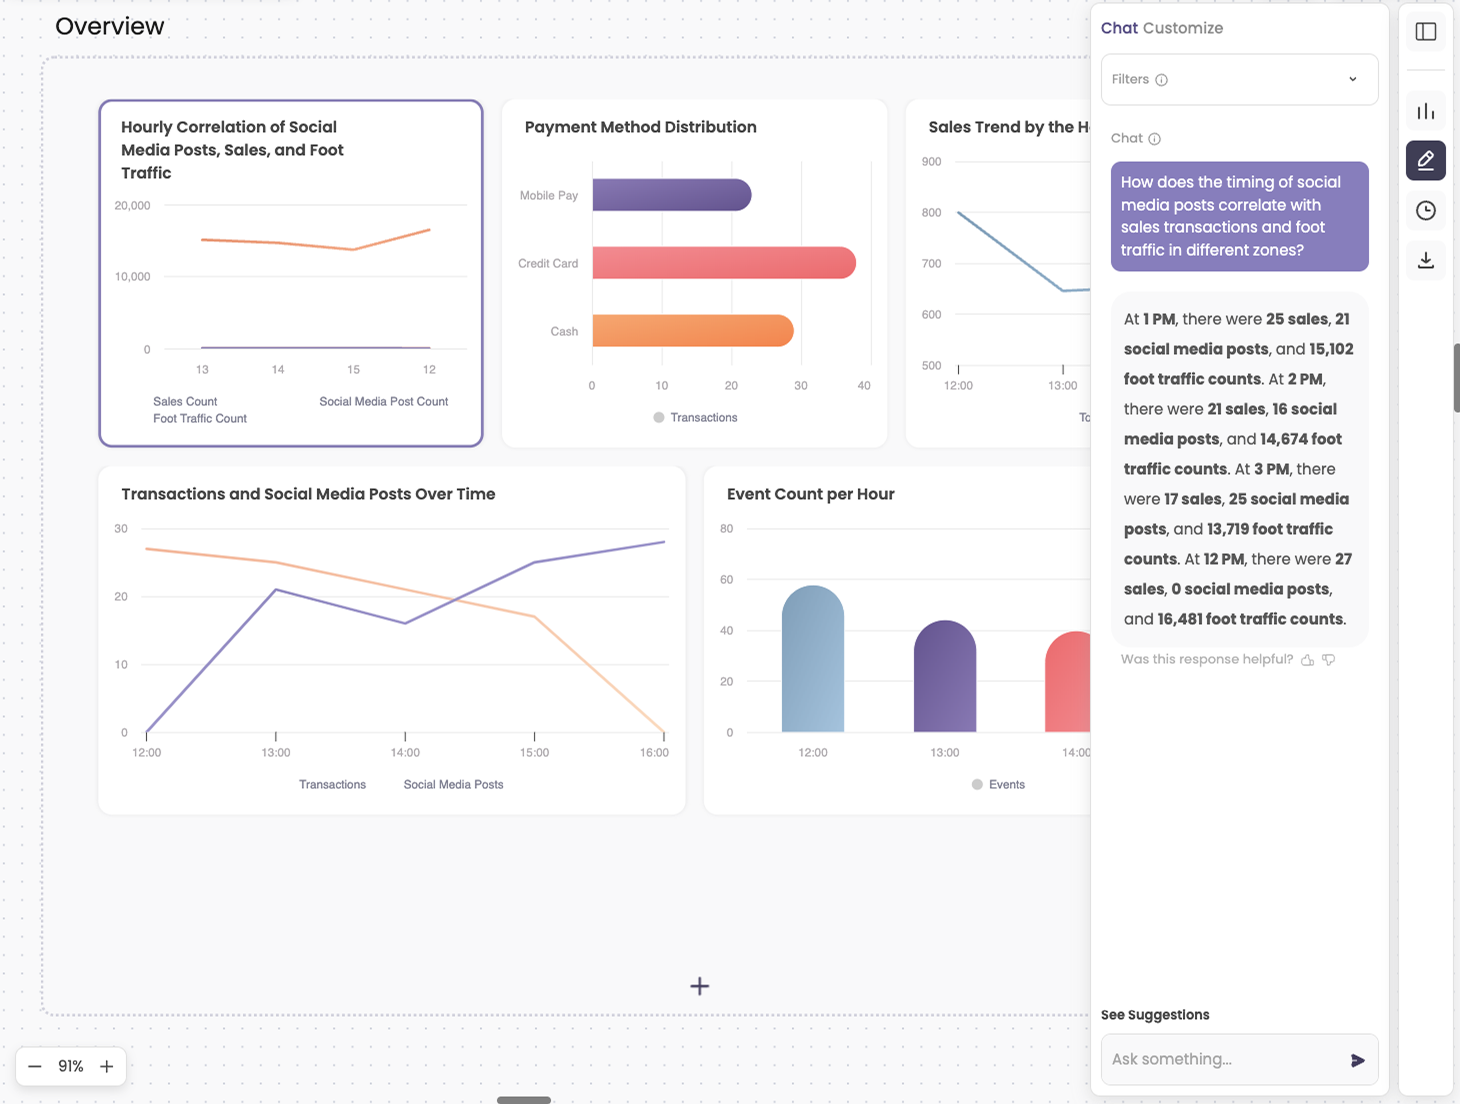
2. Add visual context
Instead of spreadsheets, use visuals—charts, heatmaps, traffic funnels, and trend lines—to help people instantly see what’s working and what’s not. With an AI report builder, these visualizations can be generated automatically based on what the data shows.
3. Go beyond numbers
Highlight key takeaways like “VIP Zone A outperformed others by 40%” or “Top-up Station 3 processed the most spend.” These types of automated insights help you tell a story that resonates with both internal teams and external partners.
4. Make reports interactive and self-serve
Instead of emailing static PDFs, use platforms that let stakeholders explore the data on their own. That could mean an interactive dashboard for sponsors, or a shareable link with clickable charts for your team. The more people can explore the data themselves, the more value they’ll get from it.
5. Deliver insights fast
Timing matters. The faster you can deliver post-event insights, the more likely they’ll drive action. AI report builders can shorten reporting cycles from days to hours—sometimes even minutes—so you can debrief with your team or sponsors while the event is still fresh.
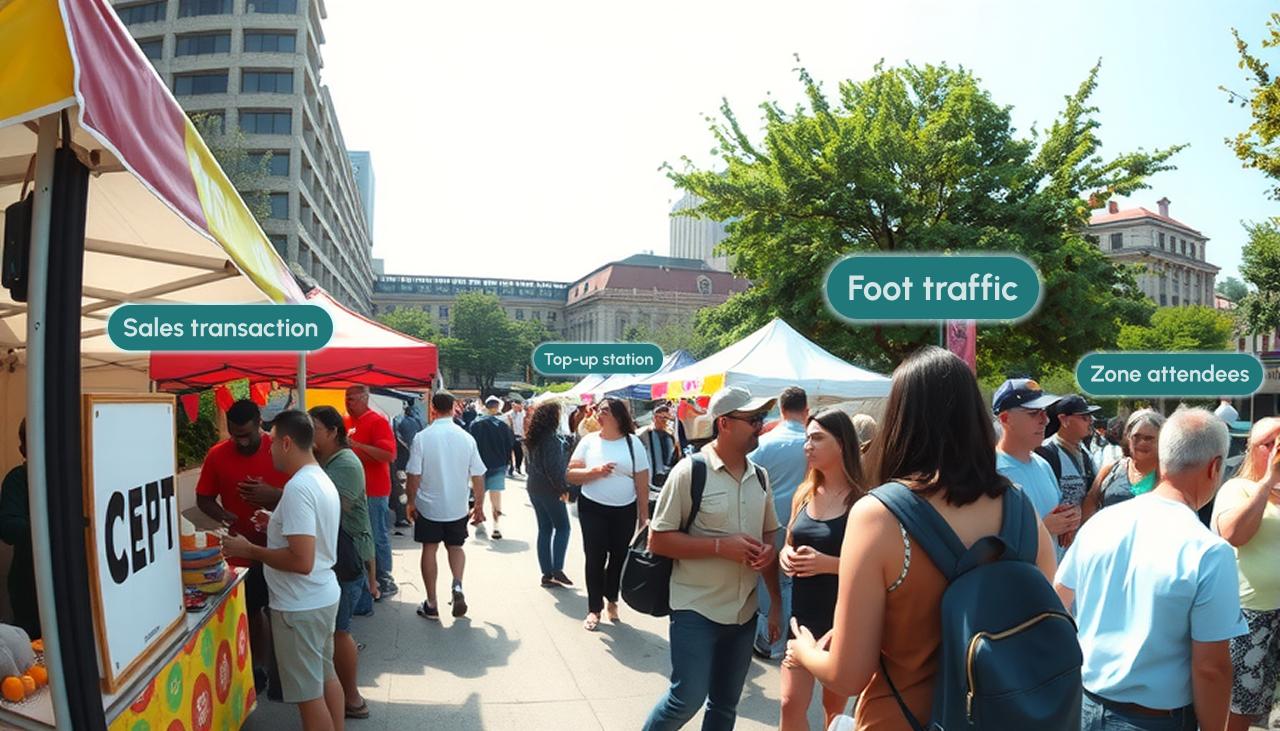
Real-world example: RFID and foot traffic analytics
Imagine you’re running a multi-day festival and you’re using RFID wristbands to track attendee movement. You already have the raw data showing:
- Which zones attendees visited
- When they arrived and how long they stayed
- What they purchased and where
- How often they topped up their accounts
With a traditional report, it might take your team days to process and visualize this data. On the other hand, with an AI report builder, those insights can be generated automatically and visualized instantly:
- “Top-up Station 3 processed 60% of total spend”
- “Zone A peaked at 3:30 PM with a 45-minute dwell time”
- “Booth C underperformed despite being in a high-traffic zone”
This kind of data, when delivered clearly and quickly, allows you to optimize future layouts, better allocate resources, and show real ROI to your sponsors.
See Zicket case study
Why this matters for the entertainment industry
In the entertainment space, competition is fierce and expectations are high. Whether you’re hosting a fan experience, a live concert, or a brand activation, stakeholders—from sponsors to marketing execs—want proof that their investment is paying off.
That proof lives in your data. But unless that data is fast, visual, and actionable, it won’t help you move forward.
An AI report tool for live events isn’t just a nice-to-have—it’s a game-changer. It helps you:
- Close the loop faster after every event
- Build trust with sponsors by proving ROI
- Continuously improve your experiences based on real insights
- Save hours of manual work and reduce dependency on technical staff
Final thought
The future of live events analytics is AI-powered, visual, and real-time.
Entertainment companies and event organizers are already sitting on a treasure trove of data. The difference between those who use it and those who don’t often comes down to tools—and the mindset to turn raw numbers into real insights.
With the right AI report builder, you can centralize your data, speed up your reporting, and turn every event into a smarter, more strategic operation.
Ready to unlock the value of your data?
See how Breadcrumb helps entertainment and event teams turn scattered data into instant insights with our AI-powered, shareable reporting platform: