April 10, 2025 - By: Victor Tang
How to Build AI-Powered Analytics Dashboards in Retool without SQL
Learn how to create powerful analytics dashboards in Retool without writing any code or SQL. Build and embed dynamic data visualizations in minutes using generative AI.
Retool has become a popular choice for building internal tools and applications, offering a powerful way to create custom interfaces for data operations. However, when it comes to building analytics dashboards, traditional Retool development can be time-consuming and complex. In this comprehensive guide, we’ll explore how Breadcrumb.ai can simplify this process by enabling you to create sophisticated analytics dashboards that can be seamlessly embedded into your Retool applications.
Why Choose Breadcrumb.ai for Retool Analytics?
Before diving into the implementation, let’s understand why Breadcrumb.ai is an excellent choice for Retool analytics:
- AI-Powered Insights: Automatic data analysis and visualization suggestions
- Rapid Development: Create dashboards in minutes instead of hours
- Seamless Integration: Native Retool compatibility
- Real-time Updates: Automatic data synchronization
- Cost-Effective: Reduce development time and maintenance costs
Traditional Analytics Dashboard Development in Retool
Building analytics dashboards in Retool typically involves several steps:
- Setting up data connections to your databases or APIs
- Writing SQL queries or API calls to fetch the data
- Creating UI components for data visualization
- Implementing filters, drill-downs, and interactive elements
- Handling data transformations and calculations
- Managing state and user interactions
While Retool provides powerful tools for this, the process can be complex and time-consuming, especially for teams without extensive data engineering expertise. This is where Breadcrumb.ai comes in to simplify the process.
Building Analytics Dashboards with Breadcrumb.ai in Retool
Breadcrumb.ai offers a more streamlined approach to creating analytics dashboards that can be embedded directly into your Retool applications. Here’s how it works:
Step 1: Create Your Dashboard in Breadcrumb.ai
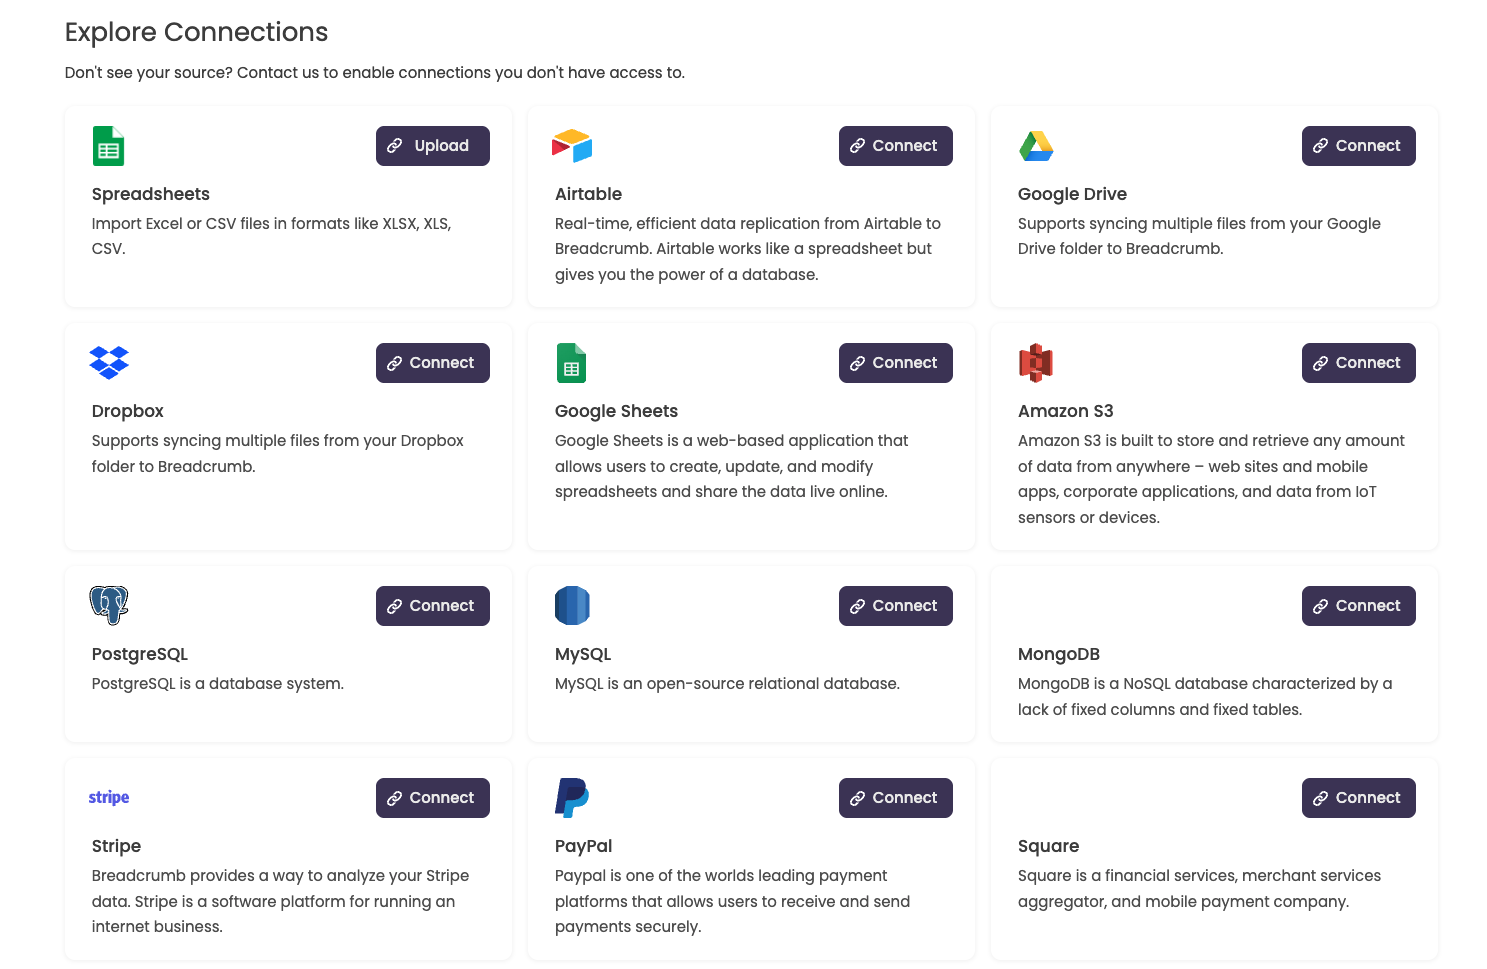
- Connect Your Data: Connect your data sources or upload your datasets directly to Breadcrumb.ai. Breadcrumb.ai supports a wide range of data sources, including:
- SQL databases (PostgreSQL, MySQL, etc.)
- NoSQL databases (MongoDB, DynamoDB)
- REST APIs (Stripe, Quickbooks, etc.)
- CSV/Excel files
- Cloud storage (S3, Google Cloud Storage)
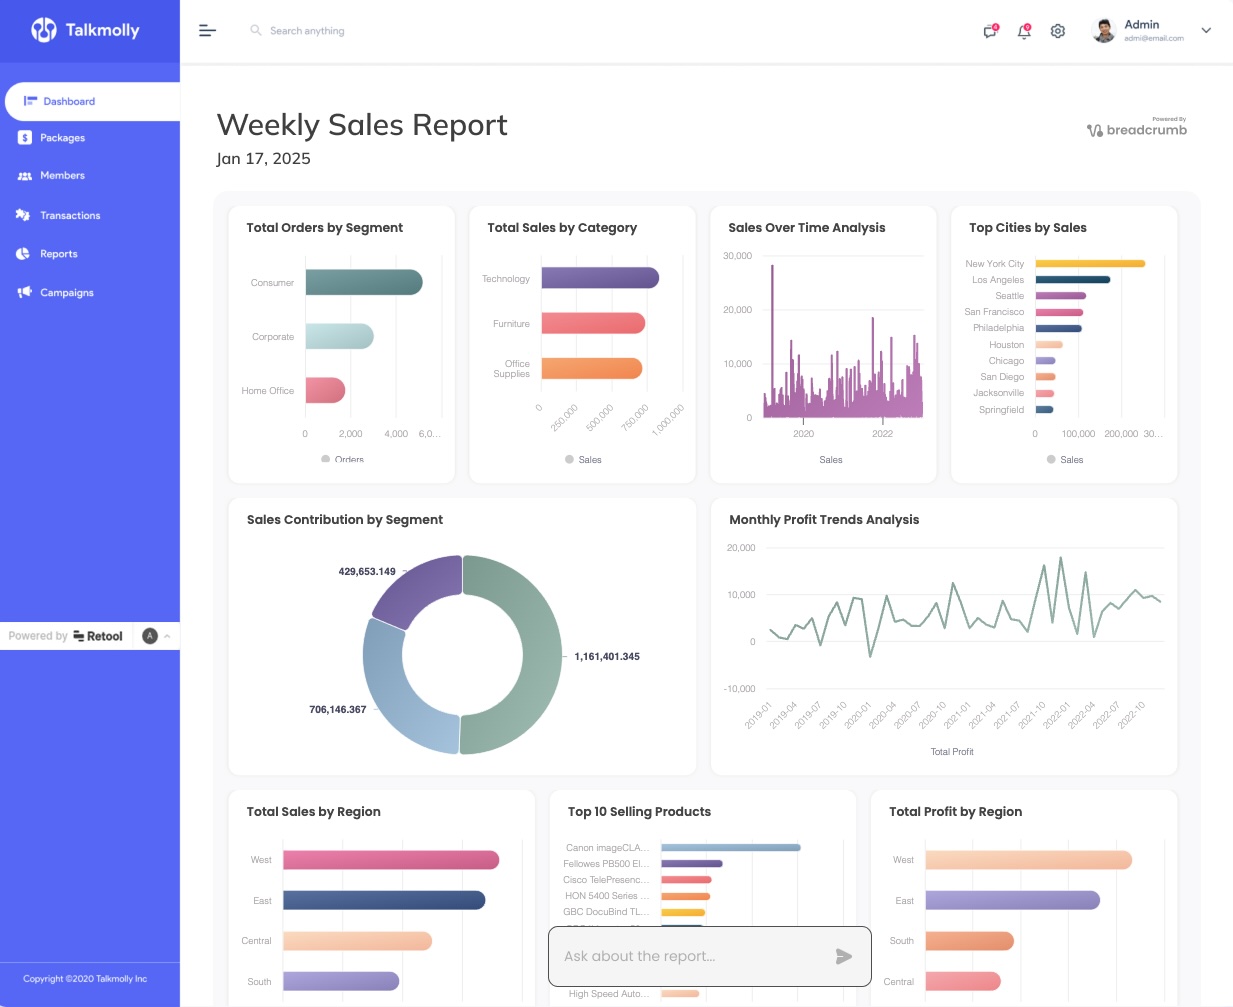
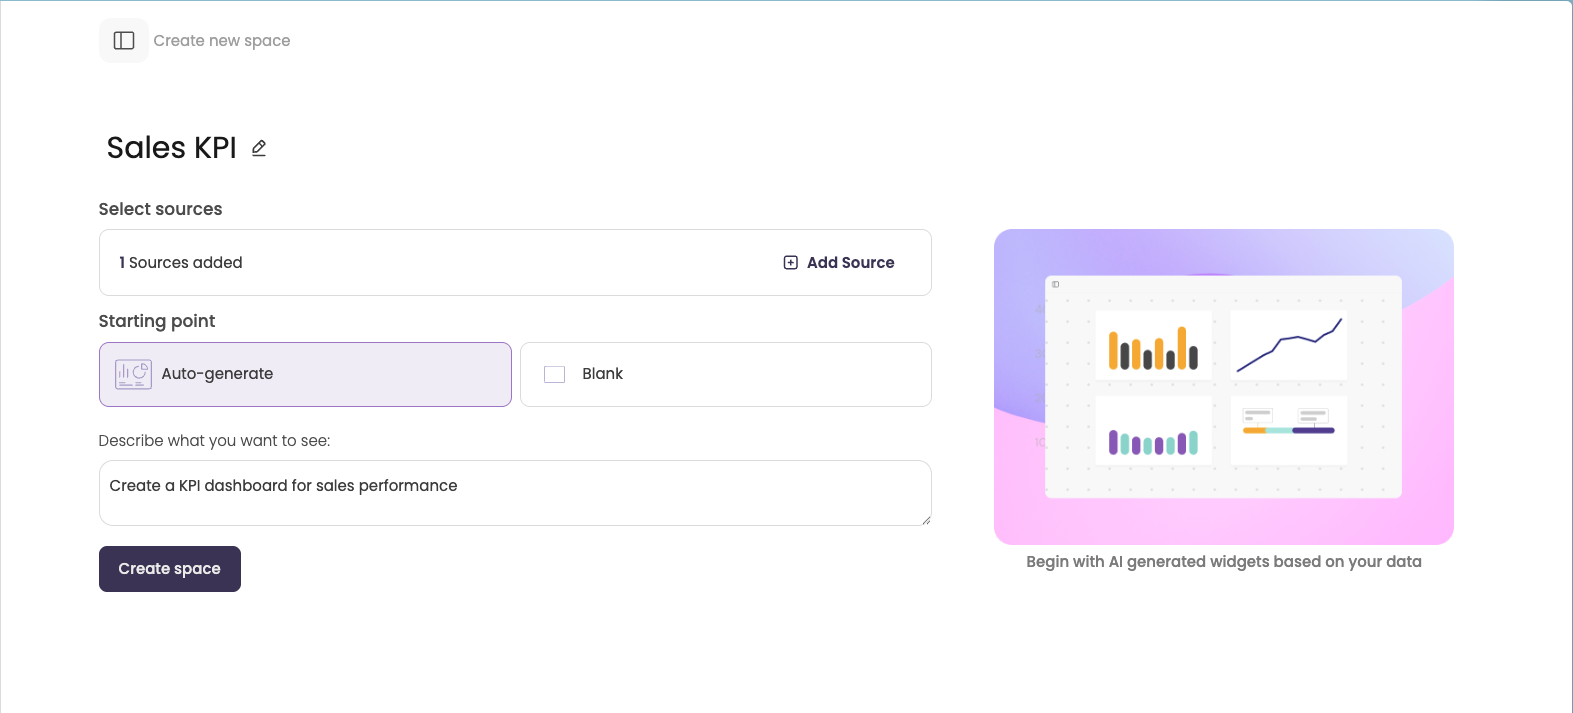
- Generate a dashboard: Let Breadcrumb.ai know what dashboard you want to create and it will automatically analyze your data and suggest relevant visualizations.
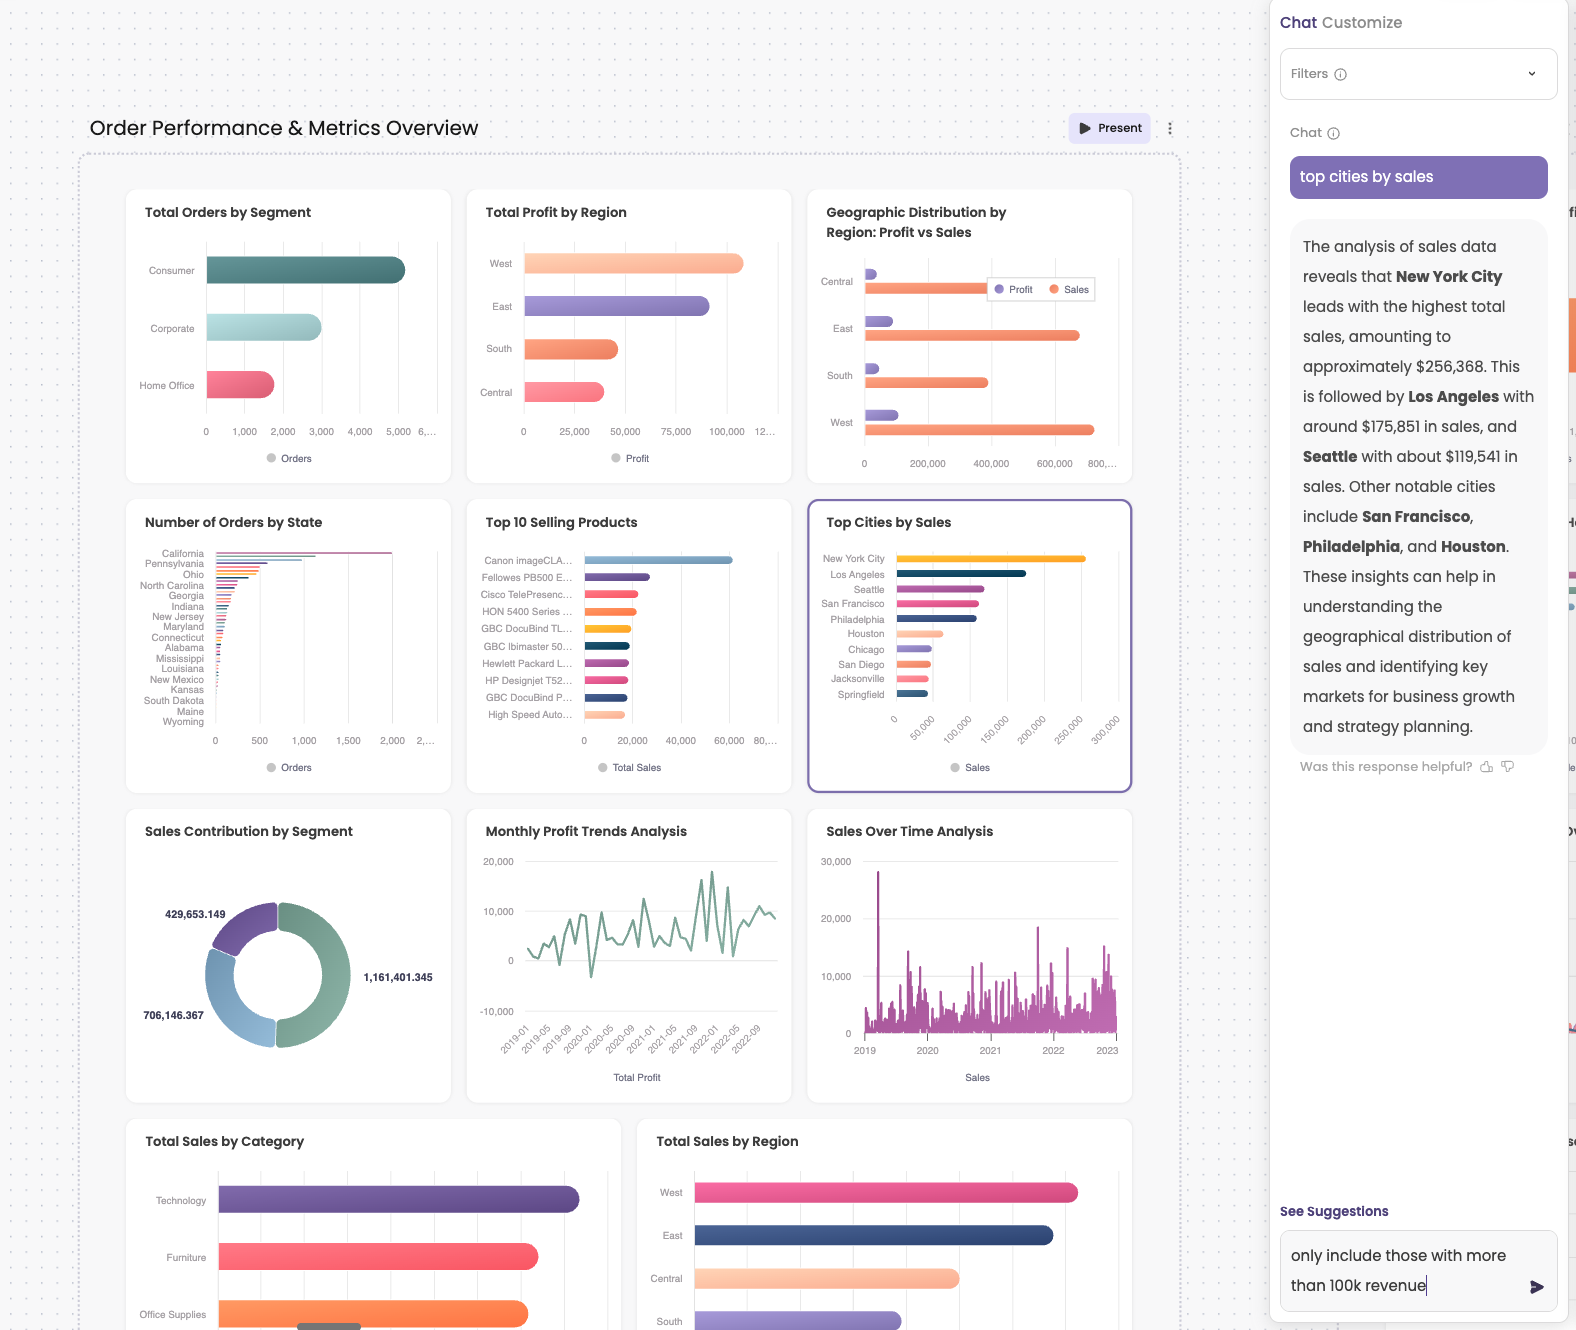
- Customize Your Dashboard: Fine-tune the visualizations, add filters, and customize the layout to match your needs by simply chatting with the AI.
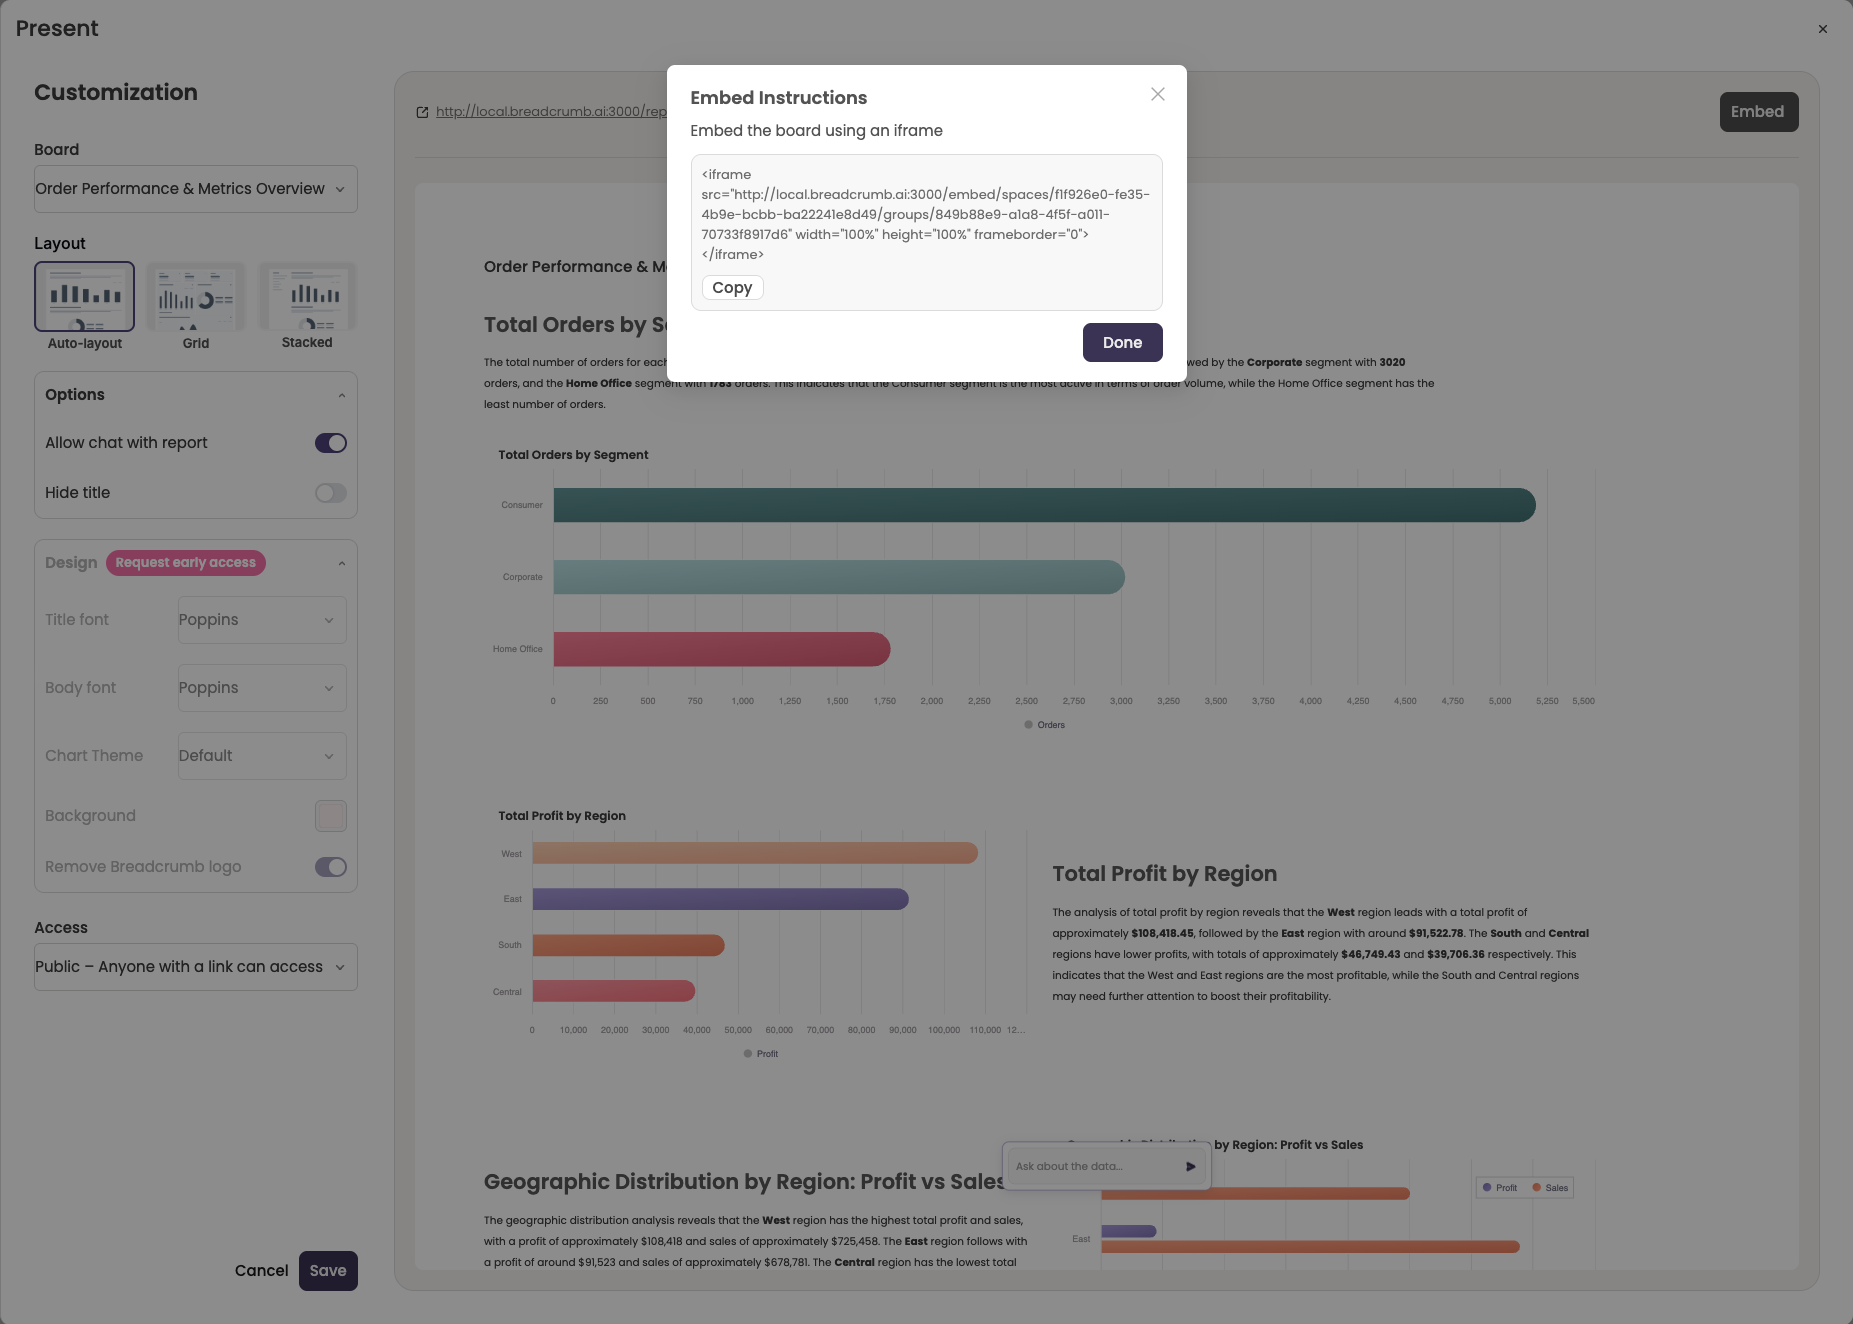
- Generate Embed Code: Once your dashboard is ready, click the “Present” button to configure the embedding. You can choose between different embedding layouts. After that, you can copy the embed code.
Step 2: Embed the Dashboard in Retool
- Create a New Retool Application: Start a new application or open an existing one where you want to add the dashboard
- Add an IFrame Component: In your Retool interface, add an IFrame component
- Configure the IFrame: Paste the embed code from Breadcrumb.ai into the IFrame component
- Customize the Integration: Adjust the size and positioning of the IFrame to fit your Retool layout
Real-World Use Cases
Here are some examples of how companies are using Breadcrumb.ai with Retool:
-
Sales Analytics Dashboard
- Real-time sales performance tracking
- Territory management visualization
- Pipeline analysis
-
Operations Monitoring
- Production metrics tracking
- Quality control analytics
- Resource utilization
-
Customer Success Metrics
- Customer health scoring
- Support ticket analysis
- Product usage patterns
Conclusion
By combining Retool’s powerful application-building capabilities with Breadcrumb.ai’s AI-powered analytics, you can create sophisticated data visualization solutions without the traditional complexity. This integration allows you to focus on delivering value to your users while letting the tools handle the technical heavy lifting.
Whether you’re building internal tools, customer-facing applications, or operational dashboards, the Retool-Breadcrumb.ai combination provides a powerful and efficient way to deliver data-driven insights to your users.
Next Steps
Ready to transform your Retool analytics dashboards? Here’s what you can do next:
- Schedule a demo and start your free trial of Breadcrumb.ai
- Explore our embedded analytics documentation
- Join our Slack community to connect with other users